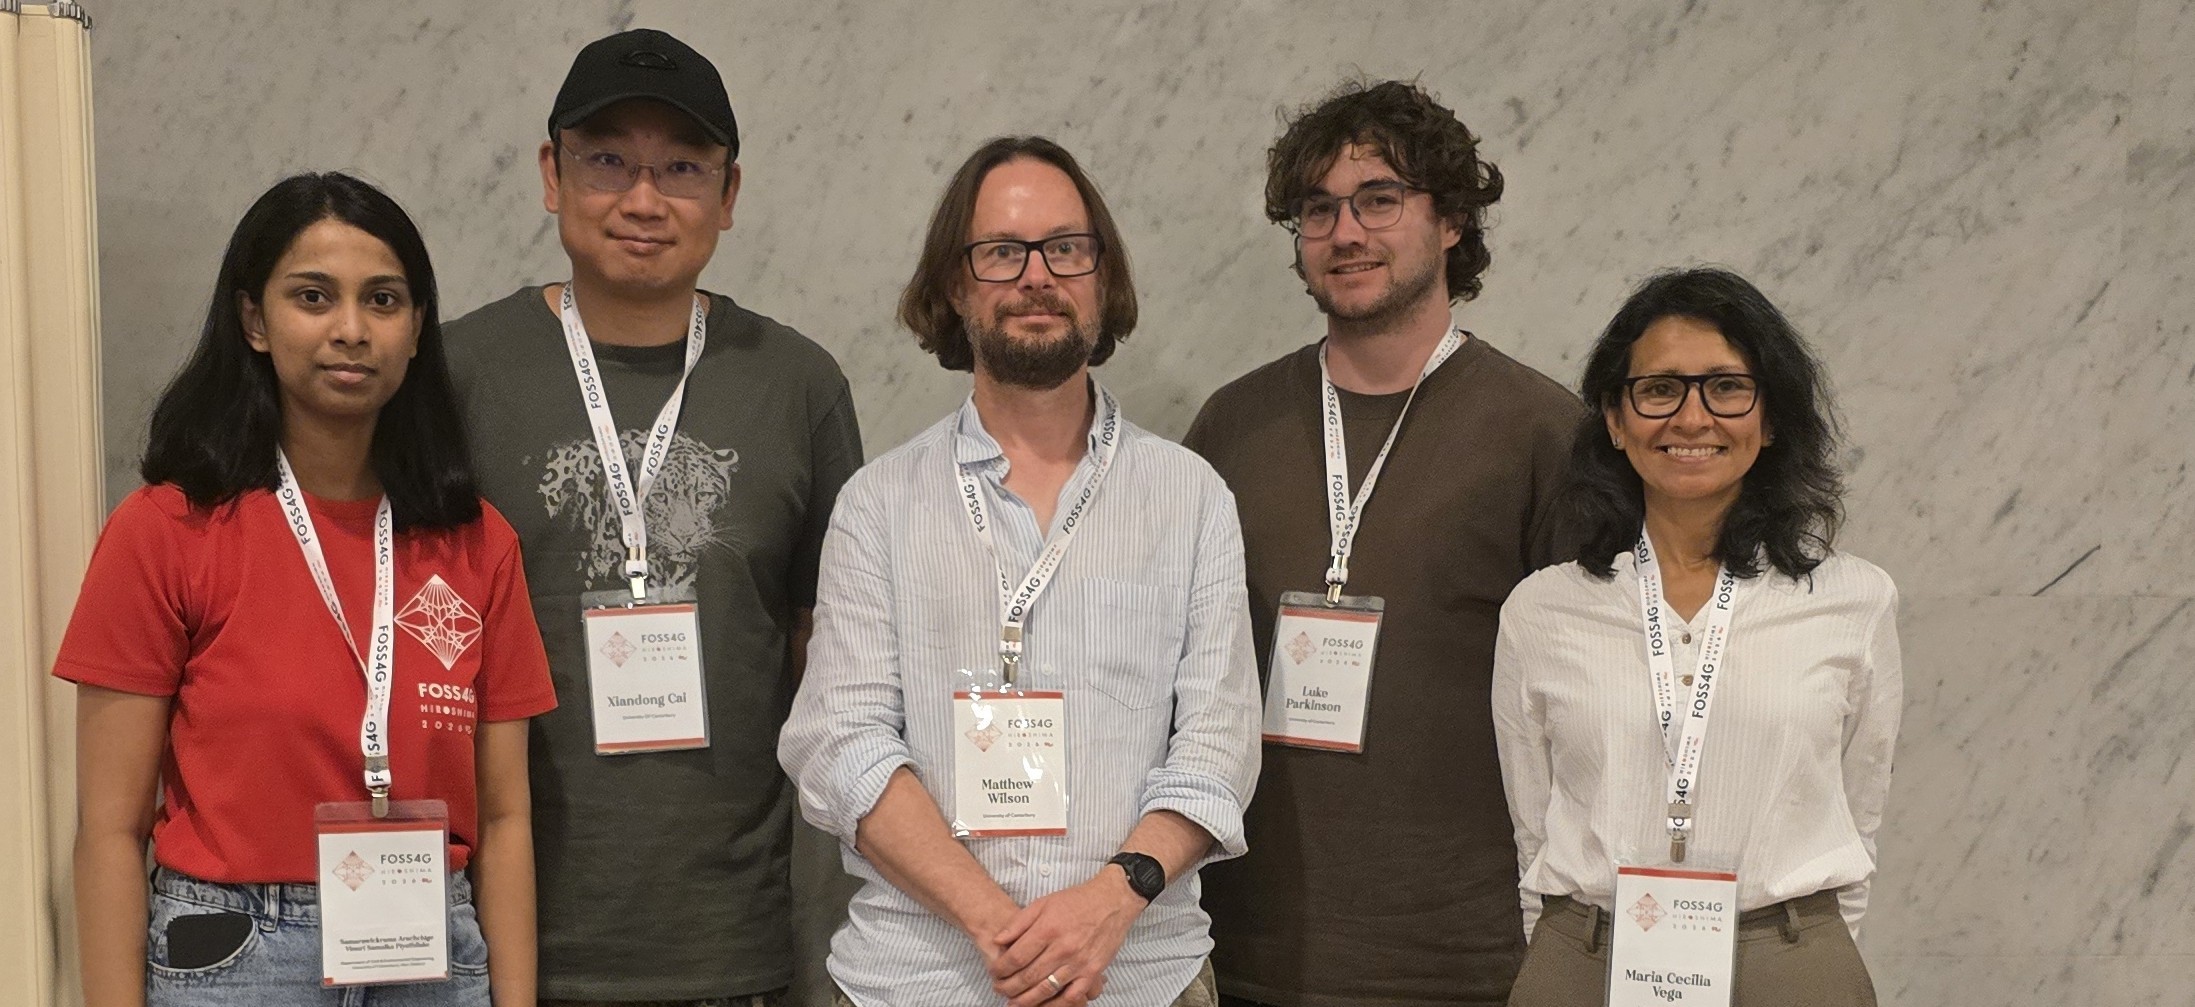
Research team
Matthew Wilson (GRI – UoC)
Maria Vega Corredor (GRI – UoC)
Georgina Dawson (PHF Science)
Russleigh Parai (PHF Science)
Luke Parkinson (GRI – UoC)
Robert McClean (Te Rūnanga O Toa Rangatira)
Funding
PHF Science (MBIE funds)
Project summary
This three-phase project (2023–2026) developed tools to understand and communicate how water and pollutants move through Porirua Harbour.
Phase 1 – Flow Model
Duration: 2023-2024
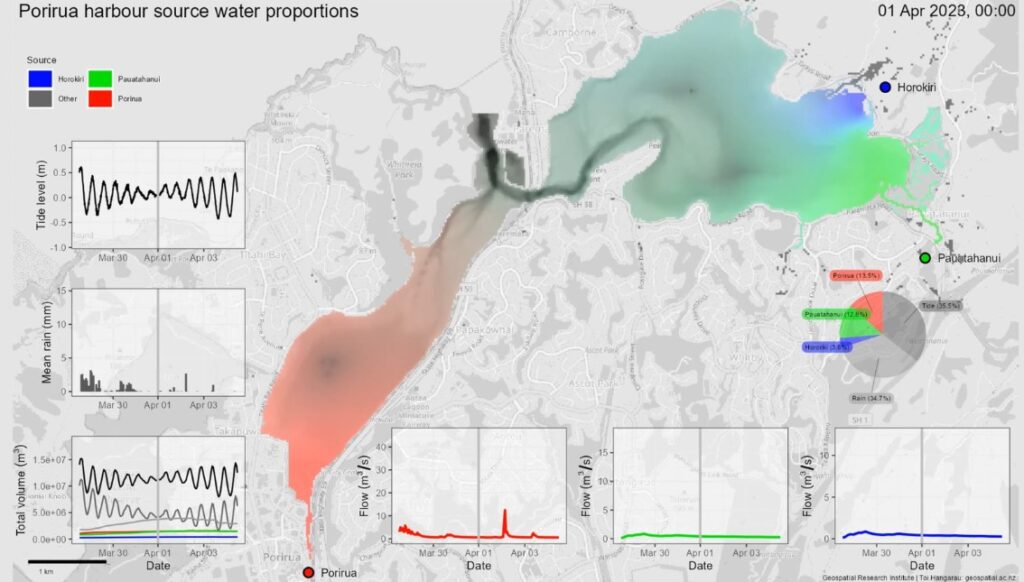
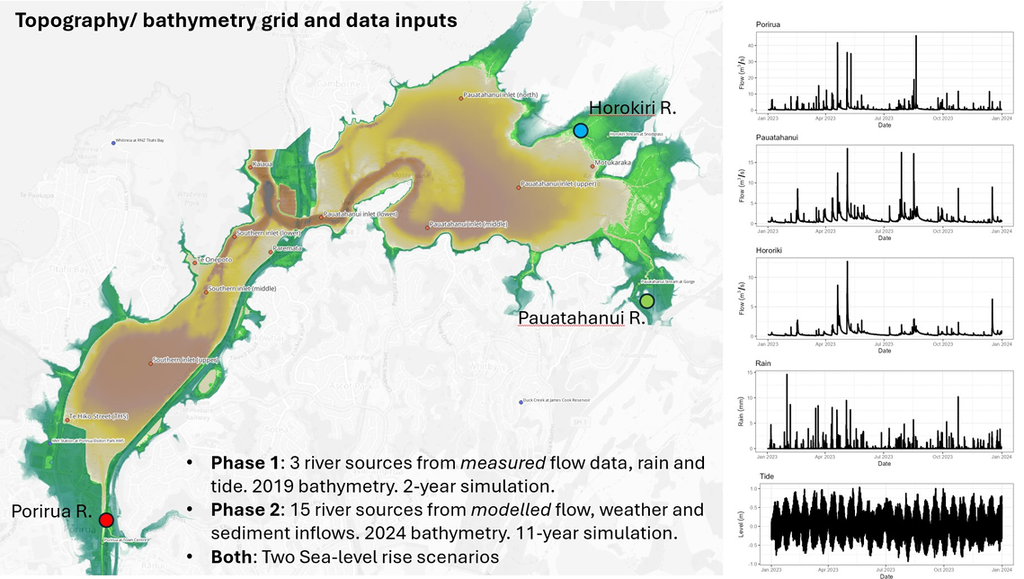
water from the Porirua stream, greens indicate the Pauatahanui, and blues indicate the Horokiri. Greys indicate
contributions from either rainfall or tide flow. Darker shades of each colour tone show deeper water. The plots
indicate either the input data, or the total volume or proportion of each source in the model domain.
A flow model of the Porirua Harbour with water source tracing capability was developed to enable an assessment of where is likely to be most affected by fluvial pollutants and assess the tidal flushing of the harbour. The model was developed and is available under open-source licensing. By using the model to assess where in the harbour is affected by which contributing water source, and by how much, results from the model an be used to infer where fluvial pollutants are likely to be within the harbour. As part of the model developments and analysis, a seamless topography-bathymetry grid suitable for hydraulic modelling was developed, observations of river flow, tide level and rainfall were obtained and processed, and the flow tracing model was constructed using open-source CAESAR-Lisflood 2.0 software. The model was run for a one-year simulation period (2023) and, in addition, two scenarios representing the potential impacts of sea level rise on water source mixing in the harbour were assessed.
Model results indicate that the proportion of river water in the harbour increases at low tide and after rainfall events in the river catchments, and that water from each non-tidal source tends to accumulate in the harbour, particularly in the upper harbour inlets and along the shorelines, as it is pushed back by the incoming tide. Since the river water carries with it pollutants from the catchments, results indicate that the locations within the harbour most likely to be affected by this are the shorelines along the upper harbour inlets. The sea level rise scenarios suggest an increase in fluvial source depths in the upper reaches at both low and high tides, with higher source depths for higher increases in sea level, which would likely worsen the situation regarding pollutants.
Phase 2 – Hydrological Catchments Model
Duration: 2025-2025
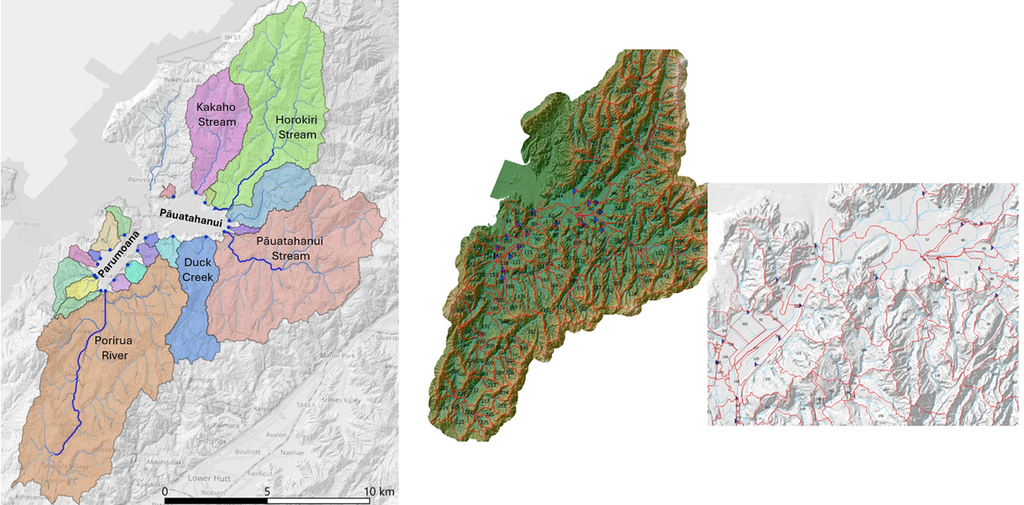
flowing into the Porirua Harbour, and how they mix with rain and tide.
Phase 2 builds on the Phase 1 flow model by developing a hydrological model of the harbour catchments, providing the land-derived inflows and sediment loads that the flow model requires. The model includes the harbour’s surrounding catchments and:
◊ Enables assessment of how catchment changes impact the health of the harbour and its community
◊ Covers the full river basin, representing land cover, soils and groundwater
◊ Runs 11 years of simulation, using weather model inputs
◊ Includes river drainage from 15 catchments used in flow model, including sediment inputs
◊ Is built with open-source software
Phase 3: Te Awarua Kai Ora Visualisation tool
Duration: 2025-2026
Phase 3 of the Porirua Harbour Flow Model Project was developed between 2024 and 2025. It was envisioned as a way to facilitate a better understanding and interpretation of the complex, and large amount of data from the flow model outputs.
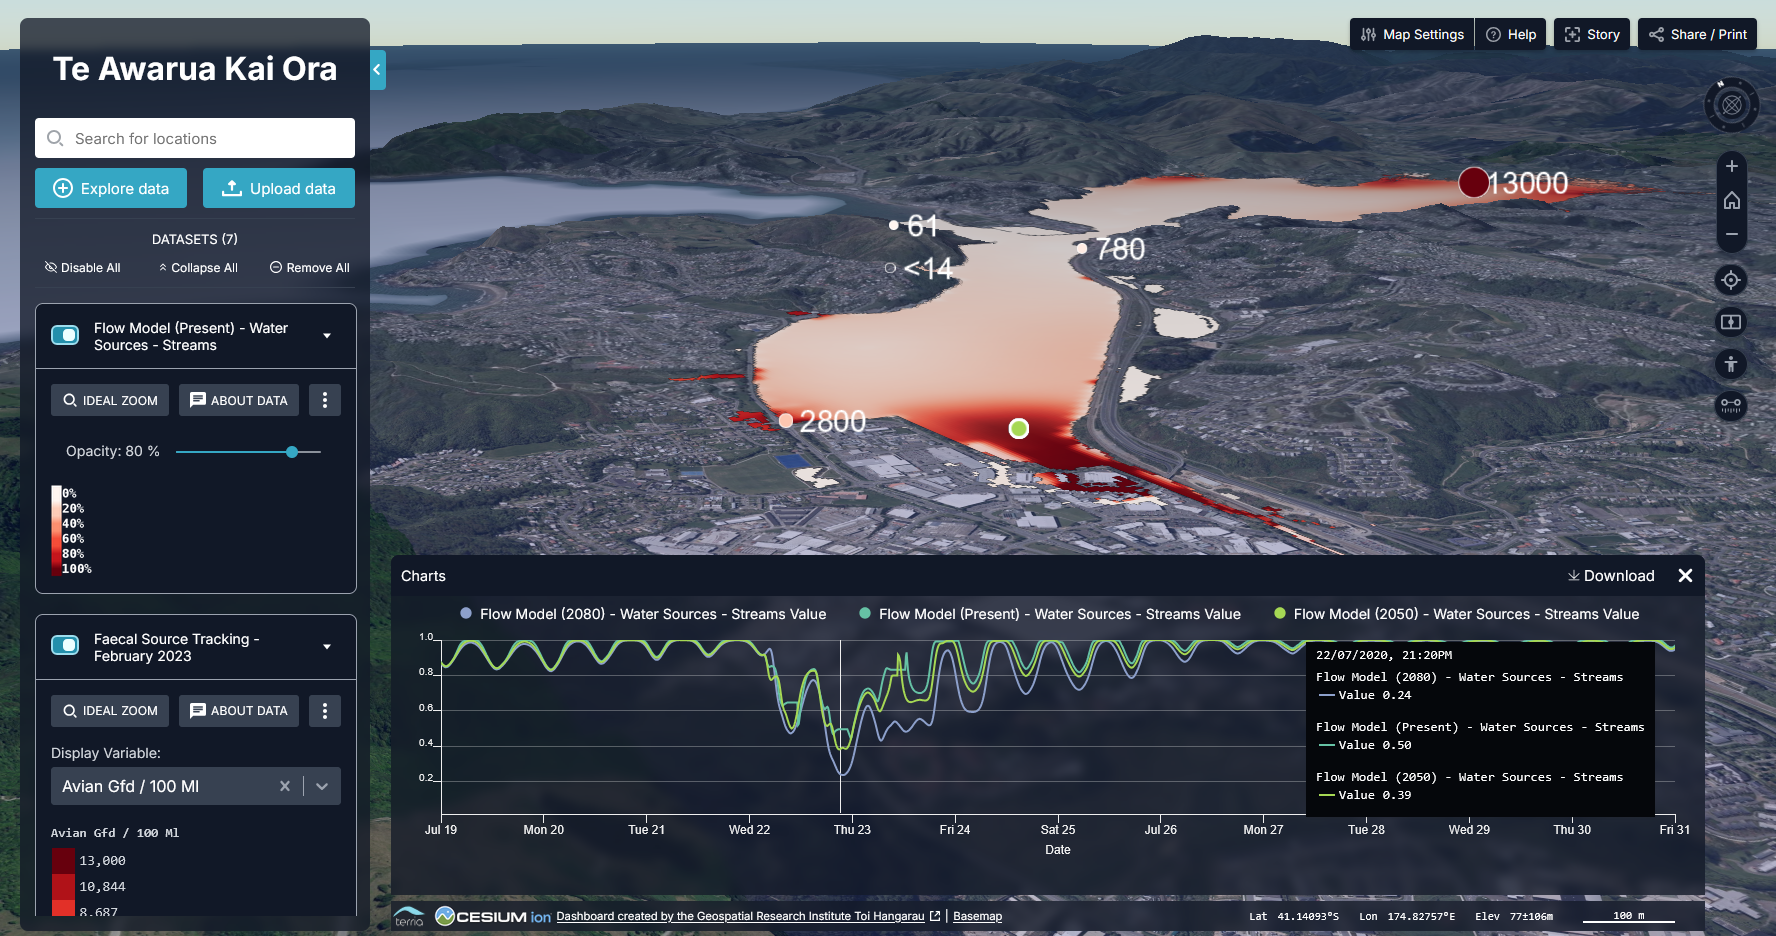
The tool, called Te Awarua Kai Ora, was designed to combine the Harbour’s flow model outputs into an interactive 3D map dashboard. It was based on the Environmental Digital Data Intelligence Engine framework, our open-source framework for developing digital twins.
From the beginning of this project, the Taiao team at Te Rūnanga o Toa Rangatira was closely involved in the development of the analysis, and provided input to the tool developed.
The development of an open-source dashboard aids community engagement and facilitates decision making. This can be extended further with other community data or analysis.
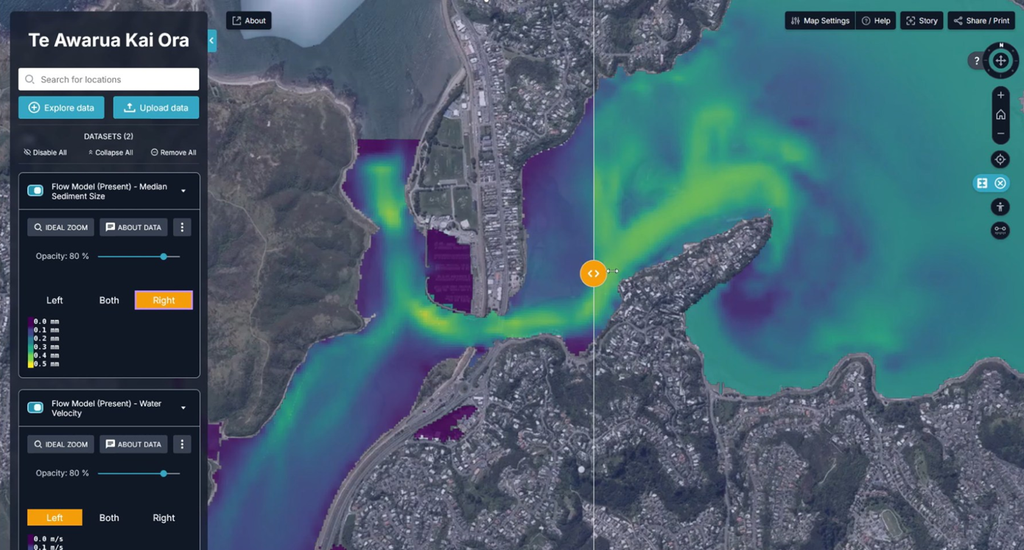
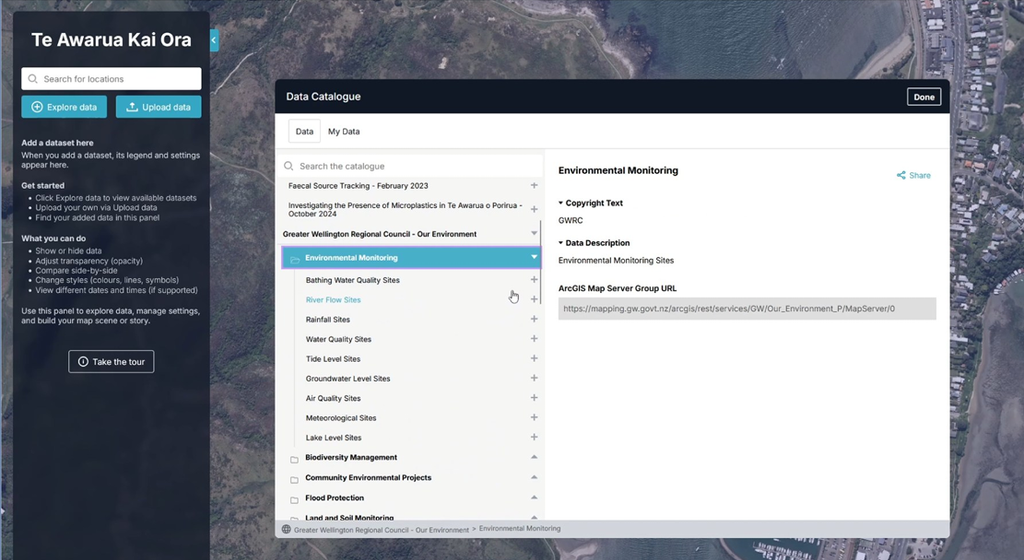
In the dashborad, users can interact with the water-tracing data to view the contributing sources at each point in the harbour. Additional geospatial data layers have been included such as PHF Science’s microplastic survey and faecal source tracing surveys, and open environmental data from Greater Wellington Regional Council.
The community members using the dashboard can understand how the flows in the harbour interact with issues that matter for them and their harbour.
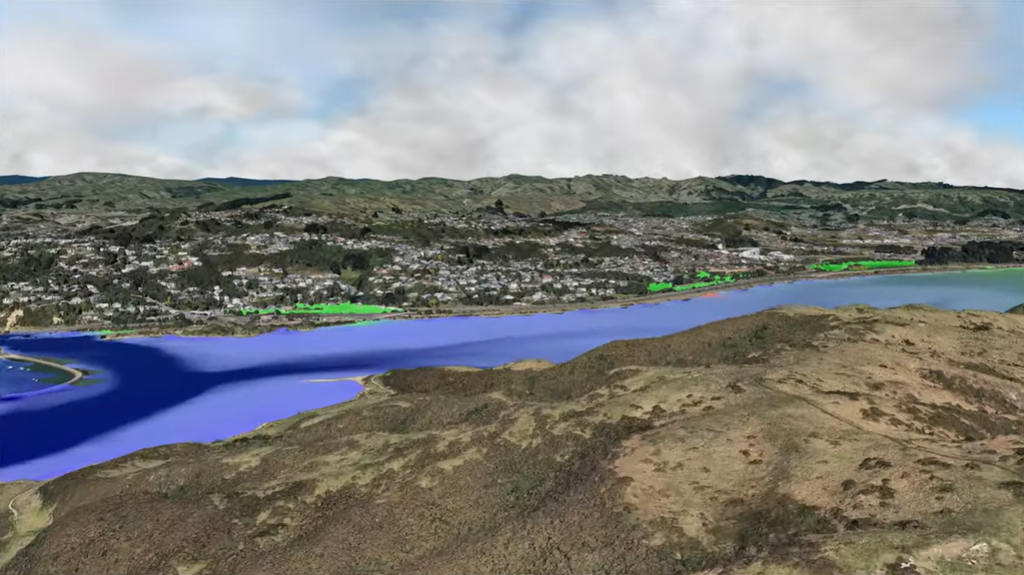
A fly-through video of the flow model outputs of the Porirua Harbour was developed in the GRI. The video and the visualisation tool are available at Te Awarua Kai Ora Visualisation platform: