Research team
Matthew Wilson (GRI) and
Tom Coulthard (University of Hull, UK)
Duration
2019-2020
Project summary
Computational models of flood inundation are often used for determining areas which may be impacted by a flood event of a particular level, and are invaluable tools for increasing our understanding of flood dynamics and risk. They work on the basis of a model grid or mesh, which discretise the domain area of interest into spatial units for which water depths are predicted. For each model grid cell or node, values which represent topographic elevation and friction are assigned. Then, during a simulation, depths for each grid cell or node are updated on the basis of flows into and out of them, with calculations of these based on the topographic slope, water surface slope and friction.
Over the last 20 or so years, “reduced complexity” models have been developed, which simplify some of the hydraulic processes considered in order to greatly improve model simulation run times. Combined with rapid improvements in computing, this has allowing much larger or more detailed simulations to be considered, ranging from large-scale detailed simulations for very large rivers such as the Amazon (e.g. Wilson et al. 2007), all the way up to continental scale simulations (e.g. Wing et al. 2017).
An understanding of how different sources of water which contribute to flooding in an area may be important for good management of river basins. For example, it may allow river managers to determine relative contribution of different river tributaries to flood risk in an area, or help them to determine where waterborne contamination from a particular source may be an issue. However, this ability is normally only contained within more complex commercial hydraulic modelling software and, until recently, was lacking from from reduced complexity codes. In this research, we developed a simple, efficient and adaptable method to track and visualise any number of water sources in a flood model simulation. Because the method is independent of the hydraulic formulation used for routing water from cell to cell, it is relatively straightforward to add to any existing flood model code.
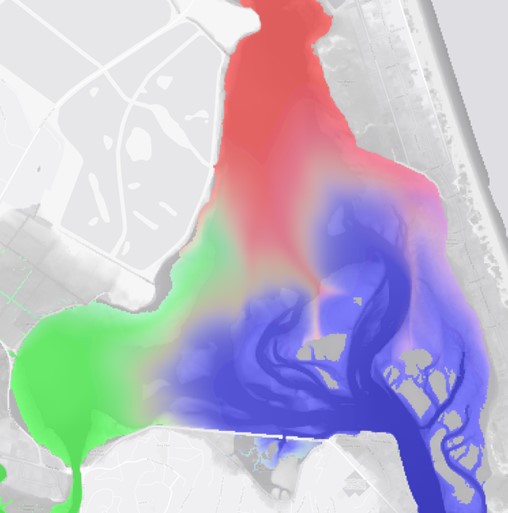
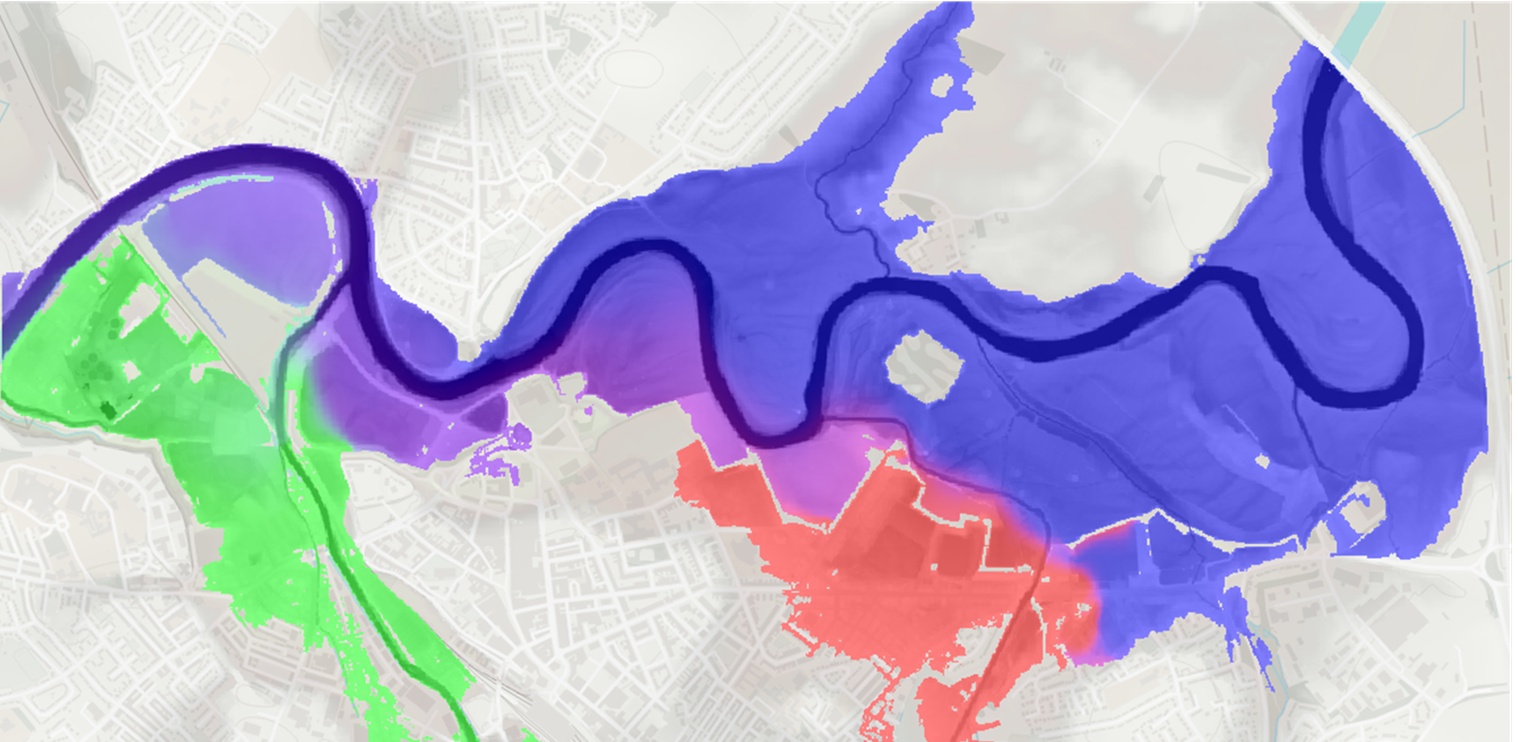
In the main picture (above), the Avon-Heathcote Estuary in Christchurch is shown during a high river flow event and a rising tide on 22 July 2017. Three water sources were considered: water coloured red on the map is from the Avon River, while water coloured green is from the Heathcote River and water shown in blue is tidal water. Darker shades indicate deeper water. The graphs (below) show the river flow rates and tide levels during July 2017, data that were used as the model dynamic boundary condition (water inflows). River flow data were provided by Environment Canterbury, while tide data were provided by the National Institute for Water and Atmospheric Research (NIWA). Topographic data from LiDAR were provided by Land Information New Zealand (LINZ). In the simulation, it can be seen than the incoming tide “pushes” the water from the Avon and Heathcote Rivers towards the western shoreline. An animated version of the map, showing the pulsing of the tide in the estuary, can be viewed at: https://youtu.be/Fczr5tczzXU
Outputs
Wilson, M.D. and Coulthard, T.J., 2019. Tracing and visualisation of contributing water sources in a model of flood inundation, Proceedings of the 15th International Conference on Geocomputation, 18-21 September 2019, Queenstown, New Zealand. https://doi.org/10.17608/k6.auckland.9869972.v2
Wilson, M. D. and Coulthard, T. J.: Tracing and visualisation of contributing water sources in the LISFLOOD-FP model of flood inundation (within CAESAR-Lisflood version 1.9j-WS), Geosci. Model Dev., 16, 2415–2436, https://doi.org/10.5194/gmd-16-2415-2023, 2023.